Free
$0forever
Enough to find the cause
Always-on tool for Windows 10 / 11
StallScope runs before the symptom does. It records every metric each second, per core and per drive, and measures, in milliseconds, the moment the machine actually stopped responding. When you remember roughly when it happened, you run one report.
"The mouse stutters sometimes." "It locks up for a second." Two things make this class of symptom hard, and neither of them is about having the right tool — they are about what time you started looking.
When
A symptom that clears in a few seconds has left no trace by the time Task Manager finishes opening. All that remains is your memory of it, so the only move left is to sit and wait for it to happen again.
What
For the few seconds it is frozen, disk latency and queue depth spike — while CPU, memory and GPU all read perfectly normal. Watching averages, or a "current value" readout, shows nothing happening at all. Smooth those seconds into a one-minute average and they are gone.
So StallScope is not "a light, tidy monitoring tool". It is built for one thing: to already be running before the symptom, and to still have the evidence afterwards.
Every design decision here is derived from those two problems.
Every performance counter is a candidate cause and nothing more. StallScope times how late its own monitoring thread wakes up, and that is the only number that answers "did the machine actually stop?" Anything past 200ms is written to the stall log by default.
Each core and each drive gets its own columns, all of them kept. "Save only the largest one" makes the distribution impossible to reconstruct later, and a single pinned core is invisible in the _Total column.
The last hour is drawn from an in-memory ring buffer, so opening the window reads nothing from disk. Starting to load days of logs while the machine is frozen would defeat the purpose.
One bar is 12 seconds; five bars are the last minute. Bar height is the worst reading in that interval, and a bar that crossed the threshold turns red. You can choose what the bars carry, and by default the icon picks whichever measure is most strained. Whatever you choose, wake-up delay keeps a band of its own across the top, so the icon never stops answering "did it actually freeze".
The report pulls out the abnormal intervals, ranks candidate causes by deviation normalised against their own quiet-time spread, and shows what was running at the time. You can lower the thresholds and re-run it.
No elevation is ever requested. The self-test measures the collection cost on the spot; on the development machine it came to 9.0ms per second, or 0.90% of one core.
Freezing is the result, not the cause. StallScope keeps every indicator from the moment it froze, side by side, so one symptom can be separated into distinct causes.
If committed memory alone was pinned at its limit, the machine was waiting on an allocation. Task Manager’s default "Memory" column shows the working set, which still looks comfortable — you cannot get here without recording commit separately.
With CPU and memory both reading normal, that is an I/O stall on the storage. The averages stay calm throughout, so it is invisible afterwards unless it was kept per drive at one-second resolution.
If a single core was pinned, the problem is the thread running on it. Total utilisation and the _Total column never show this.
A rise in DPC or interrupt time points at driver work. It is recorded per core, so which core it happened on is still there afterwards.
What settles it is never one indicator on its own — it is that the others were normal. That is why nothing is collapsed into a summary and everything is kept side by side.
Every image below is the real rendering code’s own output, not a mockup.
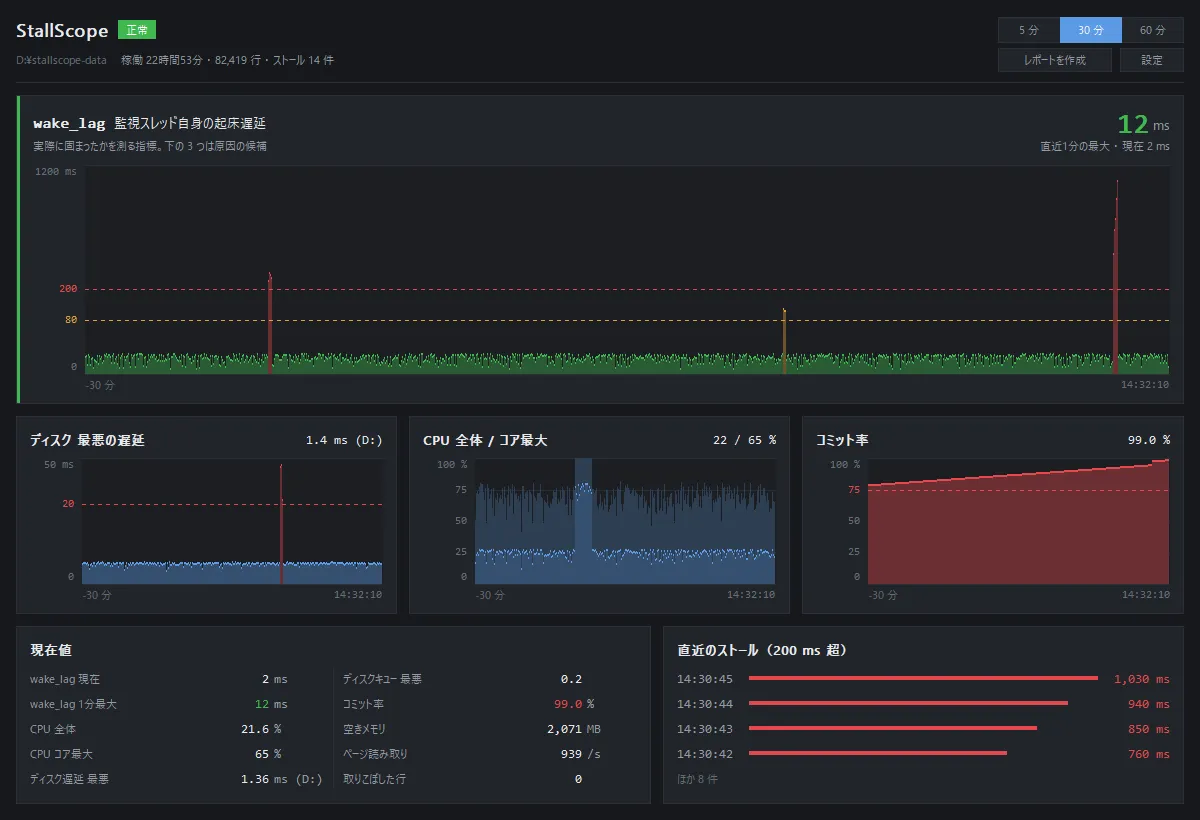
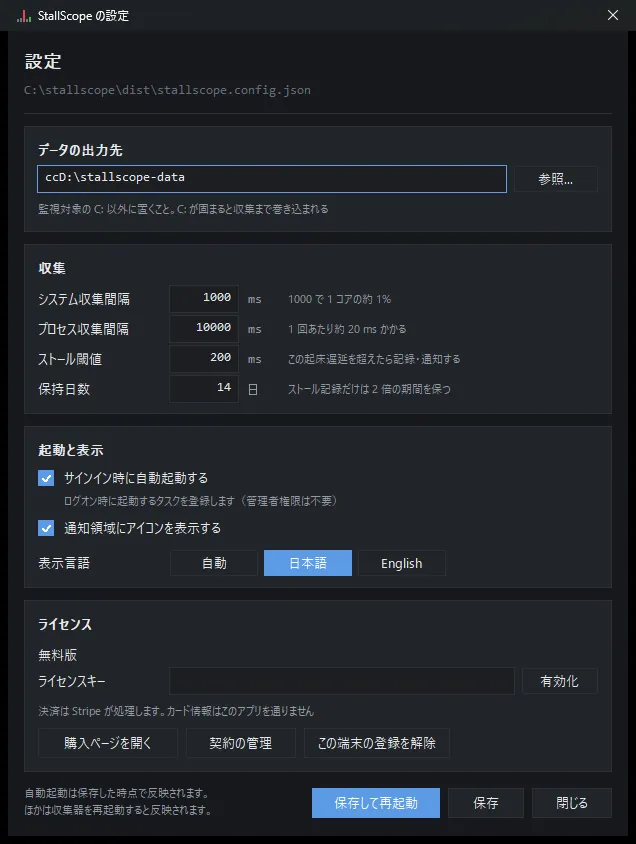

Both tiers record exactly the same thing. Pro adds ways of reading it.
| Feature | Free | Pro |
|---|---|---|
| One sample per second, every metric, per core and per drive | included | included |
| Stall detection, and a snapshot of the moment it froze | included | included |
| The analysis report: episodes, ranked factors, process involvement | included | included |
| The dashboard and the tray icon | included | included |
| Markers recording when you changed something | included | included |
| The one-line-per-day long-term summary, accumulating | included | included |
| Before/after — put the days either side of a fix side by side and see whether it worked | not included | included |
| Shareable report — an anonymised PDF, fit to send a support desk or a repair shop as it is | not included | included |
| Long-term trend — month by month, so you can see it getting worse | not included | included |
| PDF output — any report as one document, with the font embedded | not included | included |
Markers and daily summaries are recorded on the free tier too. The day you activate Pro, everything up to that point is already there to read.
$0forever
Enough to find the cause
$10 / year$1 / month
Enough to finish the job
Paying yearly costs two months less.
One key covers up to three machines at once. A machine you have not used for 30 days drops off on its own.
Payment is handled by Stripe. Card details never pass through the app.
The Store handles signing and updates. One install button, and it starts recording from the next time you log on.